Rail induced interference from power lines

Railroad Signal Protection: Planning New Power Transmission lines or Planning around Existing Lines
Railroad companies and power distribution networks often work together by sharing the same right of way. There are several concerns surrounding power transmission lines in proximity to railways. Current running in transmission line conductors produce an electric field that induces a voltage in the railroad circuits running parallel to them. When a new transmission line is being planned it’s important to make sure that its inherent design does not cause operating issues with railroad circuits. This means that at steady-state nominal current flow the voltage induced in the rail circuits is at least below the 50 Vrms IEEE human safety standard, ideally lower to increase signaling efficiency.
When examining the effects of overhead power lines on railroad circuits there are many factors that can contribute to unwanted induced voltage. The two largest factors are the level of current running through the conductors and the physical layout of the power poles and phase conductors in relation to the rails. Other factors that add to induction are phase conductor geometry, current imbalance and ground conductivity. When planning a new power line that shares a right of way with a rail circuit it is imperative to know that its inherent characteristics will not poorly effect signaling, rail detection and other rail circuits.
Numerical Solution for Effects of Overhead Power Transmission Lines
EMA uses a numerical solution to help predict and model induction effects on track circuits from overhead power transmission lines. This approach is useful for either planning for a new overhead transmission line or modeling existing conditions to better understand issues being experienced.
In the following section an example of track is presented, 1 mile long, with 5 transmission line towers. EMA’s numerical solver is used to calculate the resulting induced voltage in the track circuit. Various situations of varying current imbalance, ground conductivity, and conductor geometry are examined.
Introduction
EMA’s numerical solver is designed to work with serval inputs to produce its results. For the following example the physical location of each tower will remain constant, as well as the length of the circuit examined. Other valid inputs held constant in this document are phase conductor rotation and multiple rail sets. All power transmission is assumed to be at normal status and situations involving fault current and emergency loads are not considered in the document. Figure 1 and 2 diagram the towers and railroad circuit with relative dimensions.
Carson’s Method
The power behind EMA’s numerical solver lies in Carson’s equations for wires over a homogeneous ground. The particular form of the resulting induced electric field equations was documented by K. R. Umashankar in the Electric Power Research Institute publications “Mutual Design of Overhead Transmission Lines and Railroad Communications and Signal Systems, Vol.2”, EPRI EL-3301, October 1983. The main inputs to Carson’s equations require both a current magnitude and a distance to some victim. To save time this example will utilize the numerical solver to examine the field effects at each each tower, but this will require modifications to the problem layout defined in Figure 1 and 2. Four geometric simplifications must be generated to represent four sections of parallel transmission line and track between each tower.
Geometric reduction
The first step in the process of setting up the numerical solver involves reducing the tower-to-track layout to parallel sections, with two towers forming each section. Since each tower has a different horizontal distance from the track an equivalent distance must be used, this is simply the average horizontal distance of the two towers. To maintain the best accuracy a projection of the span length is calculated for the equivalent span by
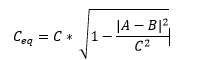
Where Ceq is the equivalent span length, C is the actual span length A is the horizontal distance from the first tower to the track, and B is the horizontal distance from the second tower to the track. Figure 1 depicts both the original power line (in red) and the equivalent power line (in blue) for this example.
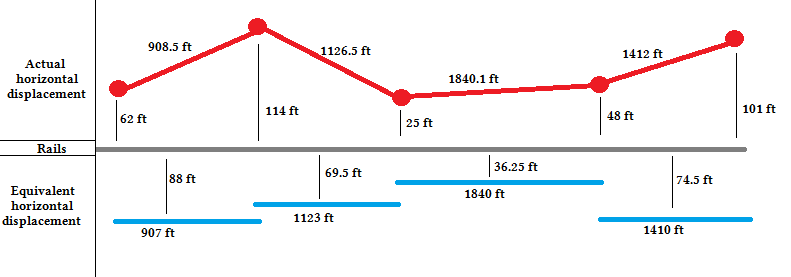
Figure 1: Horizontal displacement dimensions of actual and equivalent power lines.

Figure 2: Vertical displacement dimensions
Examining the Simulation Results
With the geometric reduction complete, the numerical solver is ready for input. The following section examines the results of changing various inputs to the numerical model and discusses the magnitude of the effect relative to other inputs.
Tower Geometry
There are three common phase conductor geometries used when power lines are installed: the wye configuration, a horizontal line configuration, and a vertical stack configuration. Figure 3 shows these tower types. The wye configuration refers to the geometric layout of the phase conductors and not the electric wye configuration also used in power transmission.

Figure 3: Diagram showing the three types of conductor configurations used
This is important because this directly affects the amount of induced voltage the railroads can experience. Figures 4 – 6 demonstrate the differences seen in these three common layouts. The vertical stack configuration helps reduce some of the effects of induction and therefore a lower induced voltage is seen. For this example both the transmission lines are running at a normal status providing a planned current of 800A. The phase conductor currents are assumed to be balanced and the soil conductivity is 0.01 σ.

Figure 4: Wye Configuration

Figure 5: Vertical Stack

Figure 6: Horizontal Line
Current Imbalance
Another common contributor to induced voltage is current imbalance in the transmission line. This happens when the current in each phase conductor drifts apart. Ideally they would all be the same current but often this is impossible to achieve especially for distribution lines because they feed many different commercial devices directly.
Even in the most ideal situations often at least 1% imbalance will exist in the lines and Figures 7 – 9 show how even a small amount of imbalance can make a difference depending on which phase conductor is affected. For this example both the transmission lines are running at a normal status providing a planned current of 800A. Both balanced and unbalanced currents of 1%, 5%, and 10% are examined. The tower geometry has the phase conductors in a vertical stack configuration and the soil conductivity is 0.01 σ. In the figures displayed below imbalance is examined in each phase conductor respectively as well as the balanced situation. For example, in Figure 7 1% imbalance in the +120° phase conductor is expressed as red dots while the balanced case is presented as a green line.

Figure 7: Current Imbalance 1%

Figure 8: Current Imbalance 5%
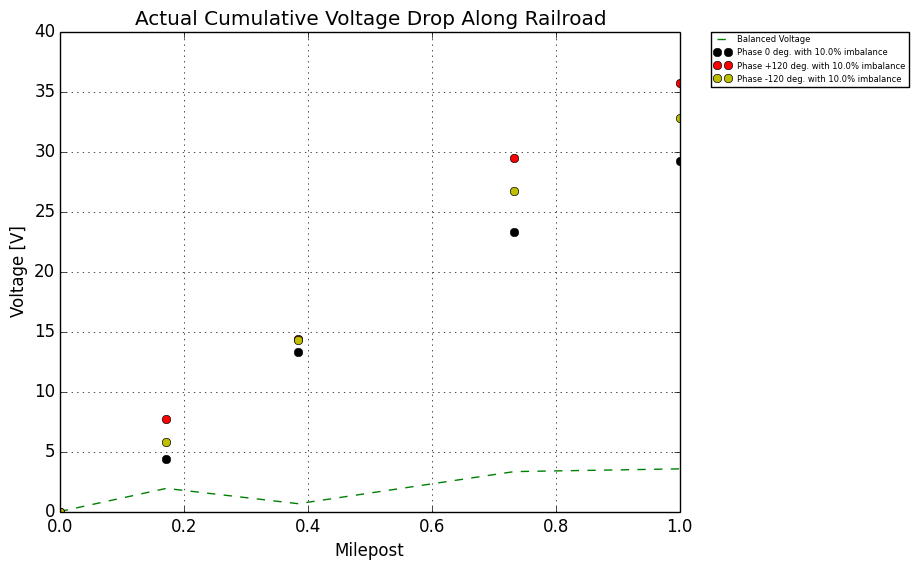
Figure 9: Current Imbalance 10%
Soil Conductivity
Lastly the conductivity of soil is important. Ballast is used to help achieve a proper ground conductivity for signaling purposes and it is important to know that the conductivity selected or that inherently exists is compatible with the overhead power lines. Figures 10 – 12 show how .001 σ, 0.01 σ, and 0.1 σ effect induction on the railroad circuit. For this example the transmission lines are running at a normal status providing a planned current of 800A. The phase conductor currents are assumed to be balanced and the tower geometry has the phase conductors in a vertical stack configuration.

Figure 10: Ground Conductivity 0.001 σ.

Figure 11: Ground Conductivity 0.01 σ.

Figure 12: Ground Conductivity 0.1 σ.
Conclusion
From the results provided in the previous section it becomes clear that certain factors affect induced voltage more than others. Probably the greatest contributor is current imbalance. A small increase from balanced to 1% imbalance in the +120° phase conductor (that is just 8 amps of imbalance in this example) almost doubled the induced voltage seen at the rail circuit. Finding 1% of current imbalance is not uncommon in the field.
Another key factor in the magnitude of induced voltage is the conductor layout. Using a vertical stack in place of a horizontal line configuration can serve to reduce the voltage seen at the rails by almost a factor of 3. This is observable in the commonplace use of vertically stacked phase conductors for three phase high voltage transmission lines. The vertical stack configuration is not always used and can be important when considering the construction of a new transmission line set.
Soil conductivity has the least effect on induced voltage with an order of magnitude change only increasing the induced voltage by a factor of about 1.5. Average soil conductivities range between 0 and 0.1 for most soil types so it is not expected that soil conductivity would ever be the defining factor when examining induced voltage.
Together these three factors can add up to push voltage above dangerous levels. For the example layout used, voltages never got above the 50 Vrms IEEE standard, but a 1 mile section of track circuit is short in comparison to what can exist in the field. A longer track will see a larger induced voltage and it is easy to extrapolate the results provided to show that within a few miles most of the above examples would be at or near the 50 Vrms level. There are more complicated techniques such as phase flipping that can be used to reduce voltage in cases such as those, but those techniques are not presented here. For a demonstration or any questions please contact Electro Magnetic Applications, Inc. EMA provides the highest standard in signal and track circuit protection. A much more in-depth explanation can be provided upon request.